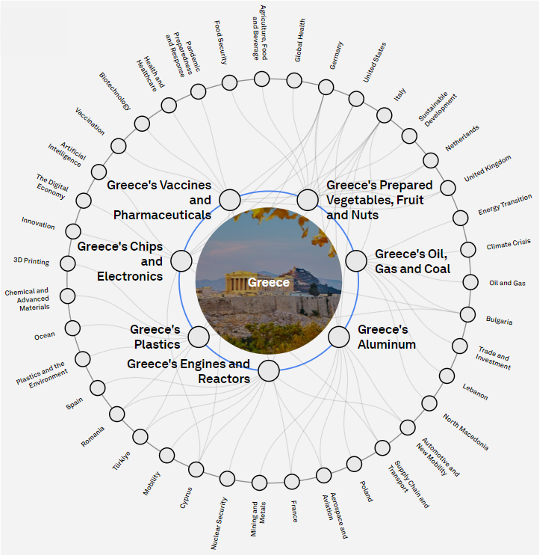
The Transformation Map presents related information about Greece, using the most recent data available from the Observatory of Economic Complexity (2022) | World Economic Forum.
Greece’s top exports appear as key issues on the map’s inner ring (e.g. Aluminium, vaccines & pharmaceuticals, plastics, vegetables, etc.
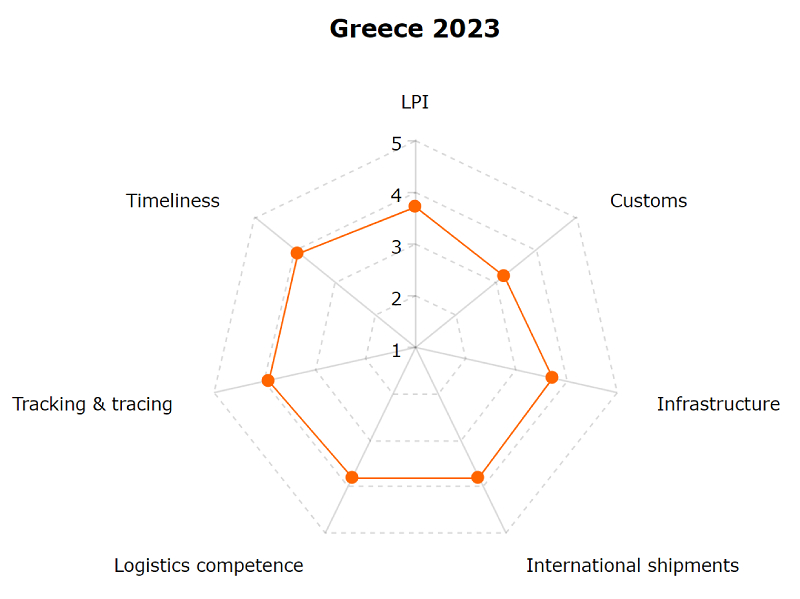
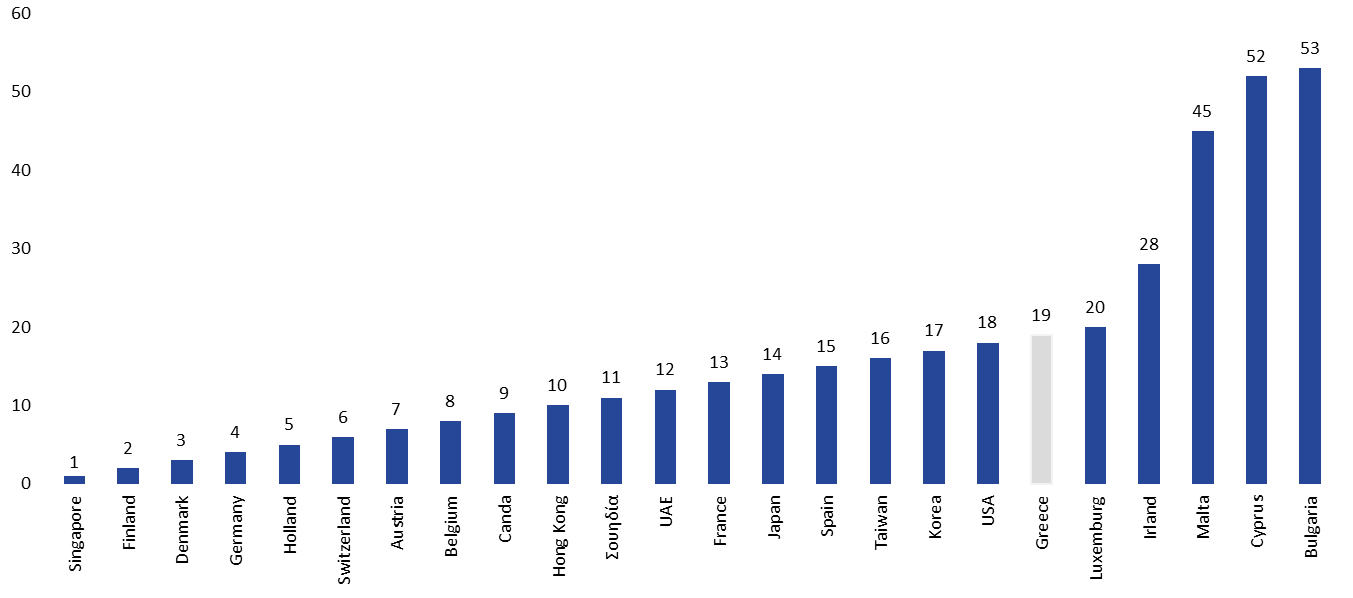
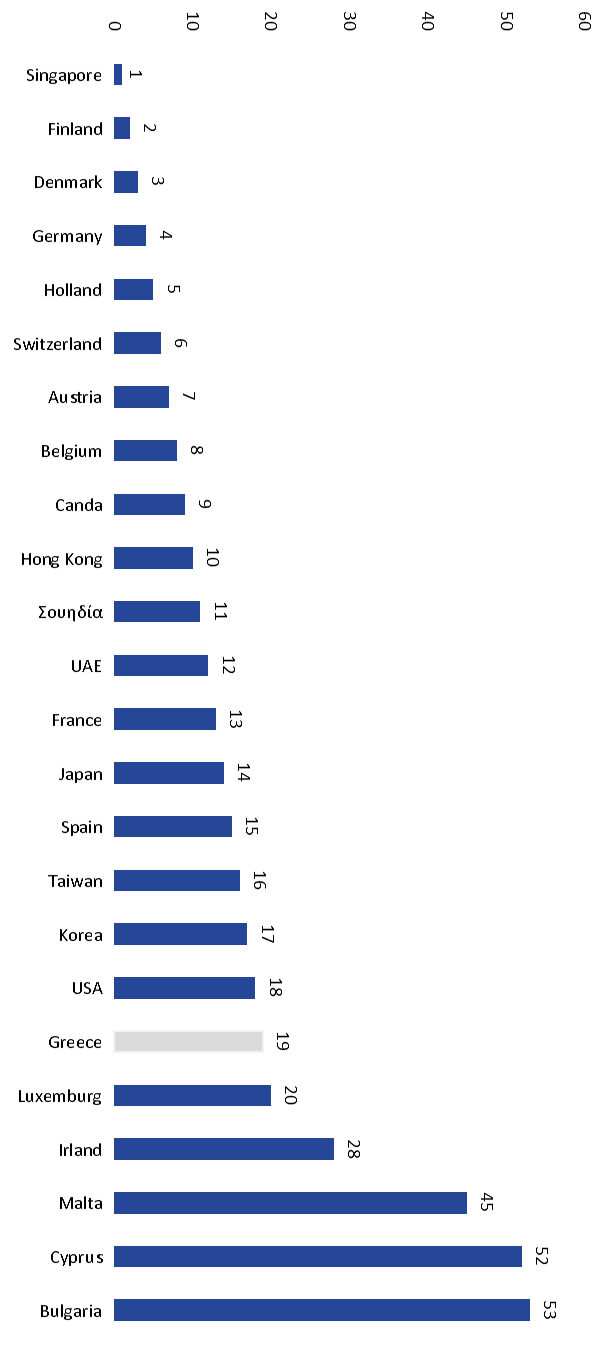
Source: World Bank, 2024
6 key parameters that are used for assessing logistics performance of a country. Greece LPI score: 3.7.
The LPI is an interactive benchmarking tool created to help countries identify the challenges and opportunities they face in their performance on trade logistics and what they can do to improve their performance.
Greece ranks 19th in the LPI results for 2023, along with China, Italy & the UK
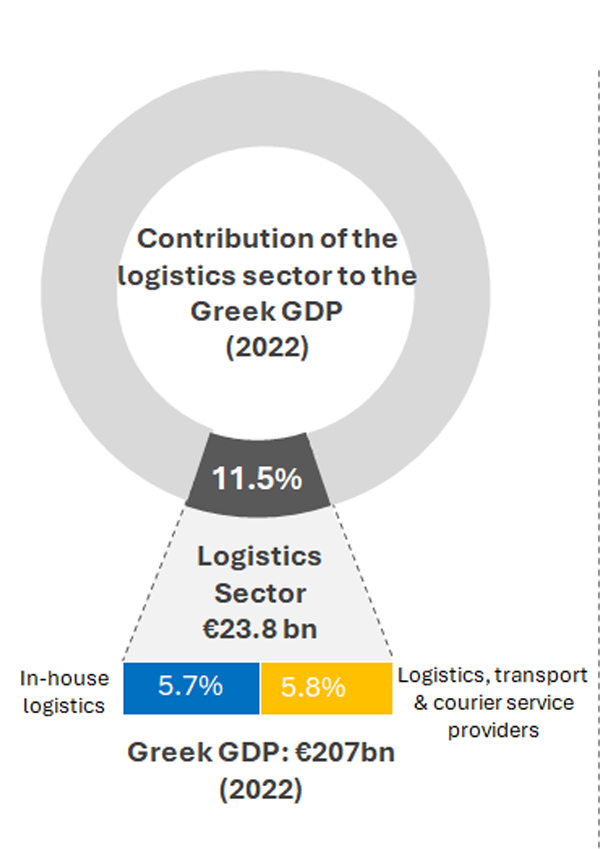
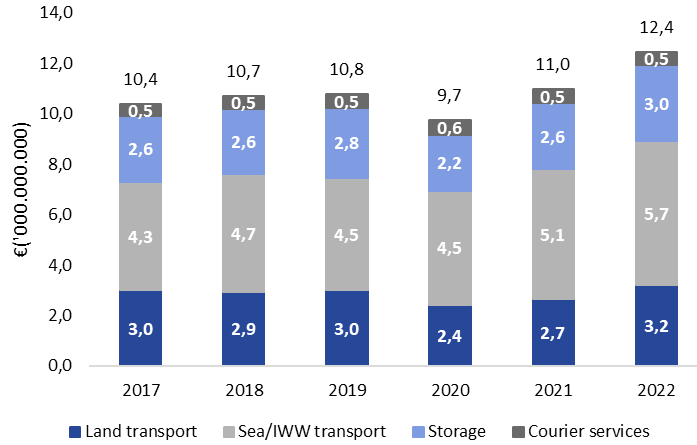
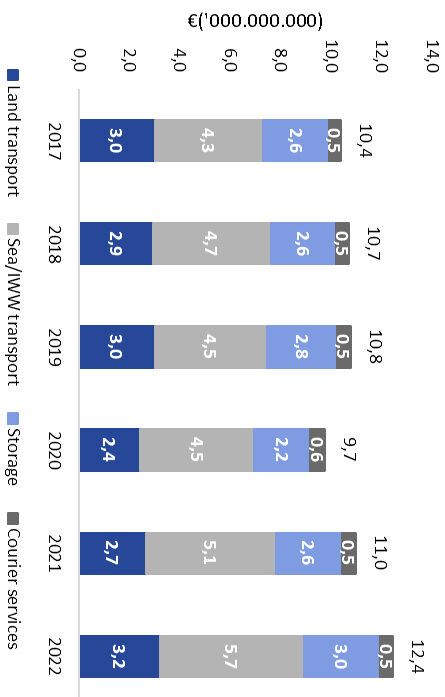
The contribution of the logistics sector to GVA has increased by 19.8% during the period 2017-2022. It contributes around 6.85% to the Greek GVA (€181.7bn)
Gross Value Added (GVA) is the difference between production and intermediate consumption. It is equal to the sum of compensation of employees, consumption of fixed capital, net operating surplus and other taxes less production subsidies (ESA, 2010). Output is defined as all goods and services produced during the reference period, while intermediate consumption refers to goods and services consumed as inputs in the production process, excluding fixed assets.
Source: ELSTAT, 2024; EUROSTAT, 2024